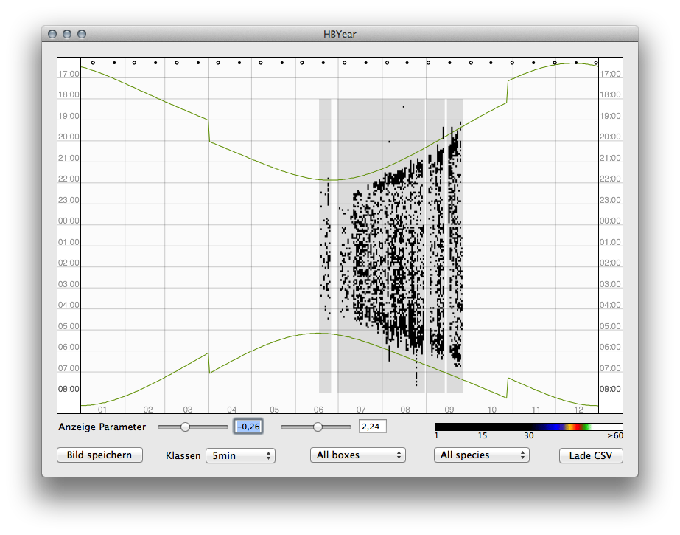
HBYear plots data collected via classical “horchboxen” in a simple to read graph. The app was developed together with Büro Echolot to plot such data for analysis and reports. The graph is based on CSV files containing timestamped activity data. HBYear runs on OS X10.7 or newer.
Input format
The csv file needs a fixed structure to be compatible with HBYear. Recognized file extensions are csv and hby. Each line needs to comply to the following format: 20.06.2013;pp;02:32;18:00;8:00;Location;Data-origin.txt;7.59454,51.83345
- 1st column: Date of contacts
- 2nd column: species
- 3rd column: Time of contacts; time must be formatted according to Hours:Minutes (HH:MM)
- 4th column: Start of sampling; used to plot sample times in graph; time must be formatted according to Hours:Minutes (HH:MM)
- 5th column: End of sampling; used to plot sample times in graph; time must be formatted according to Hours:Minutes (HH:MM)
- 6th column: Name of location
- 7th column: Fiel containing original data
- 8th /9th column: Longitude and Latitude for calculating sunset and sunrise
For correct interpretation of the input file some more requirements have to be fulfilled. Columns have to be separated by semicolon (;). Longitude and latitude require a decimal point. Dates have to comply to either DD.MM.YYYY or DD/MM/YYYY. The columns 6 and 7 may be empty.
HBYear
available since 16. October 2015Programm zur Erstellung einer Jahreszeitlichen Aktivitätsgrafik basierend auf CSVDaten aus der Horchbox-Auswertung.
MD5 hash of the file HBYear.zip:
2d026a017143c42bf051fab4ece46906